Start With the Audience and Decision
A data story must be shaped around what the audience knows, values, misunderstands, and can act on.
Data-only
"Here are the retention rates for four cohorts." The audience must infer what matters, whether the numbers are good, and what choice is being requested.
Story-led
"If we must protect one cohort this month, Cohort D is the risk: its retention is 25 points below the target and the support team can intervene before Week 3."
Use in class
- Name the audience before choosing the format.
- Separate exploratory analysis from final communication.
- State what decision, belief, or next question the story is meant to affect.
Examples
Audience-Specific Exploration
Story: gun deaths are not one problem; suicide, homicide, age, gender, and race point to different prevention conversations.
Open project listingQuestions for Public Understanding
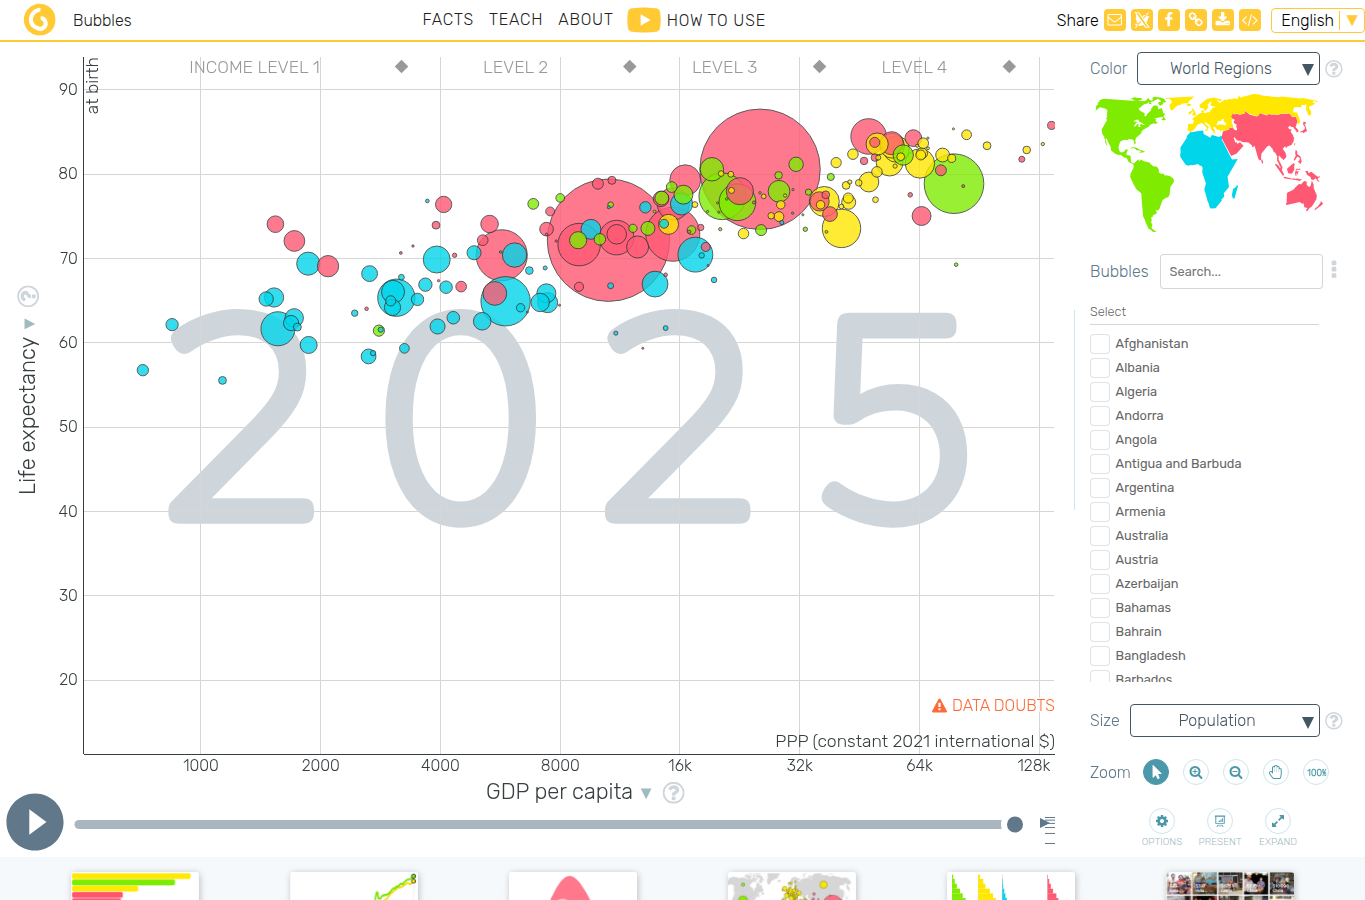
Story: long-run public data can correct pessimistic or simplistic beliefs when charts are organized around human questions.
Open OWIDChart Communication Practice
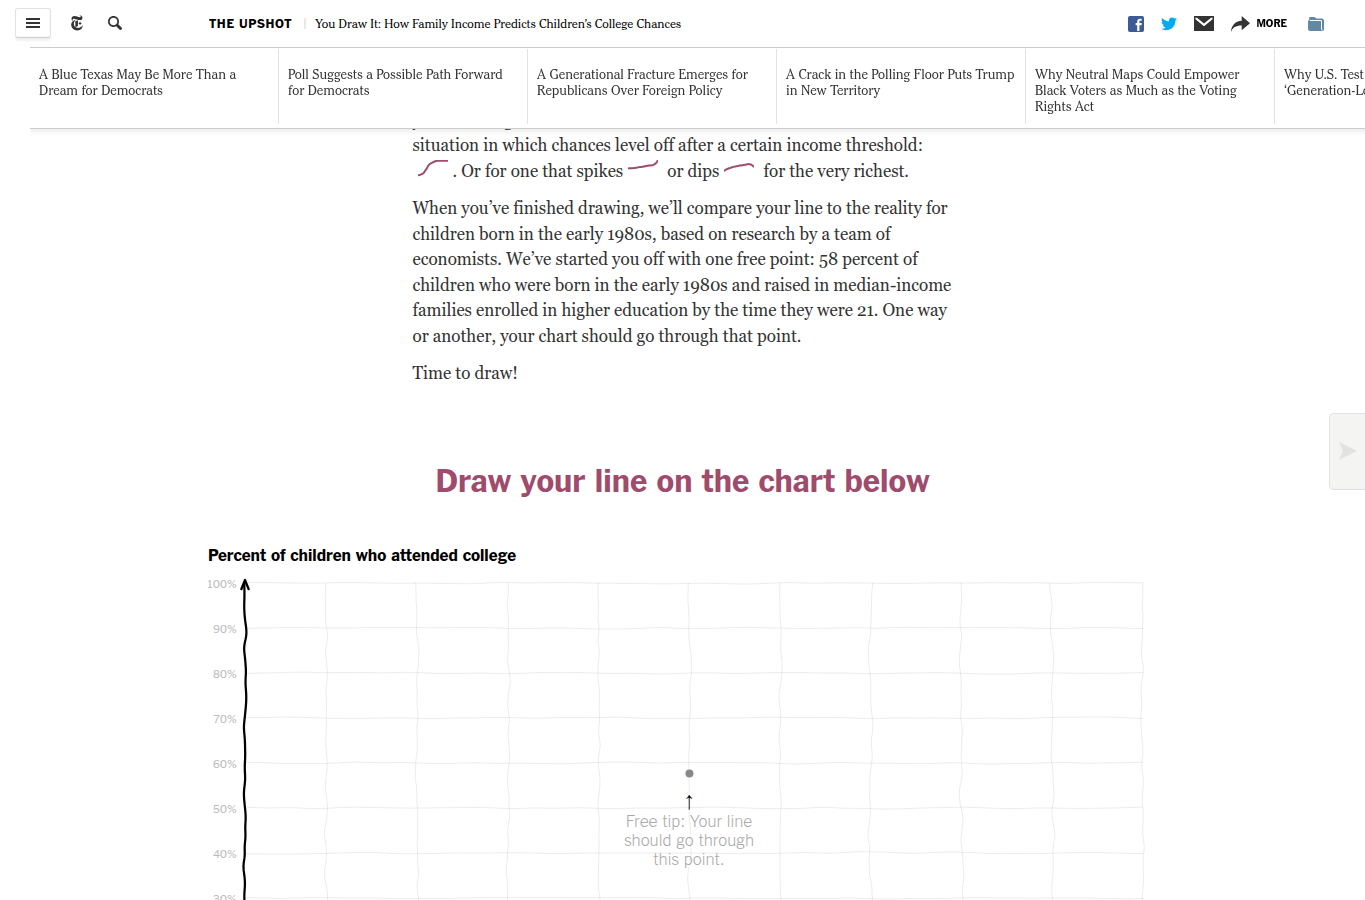
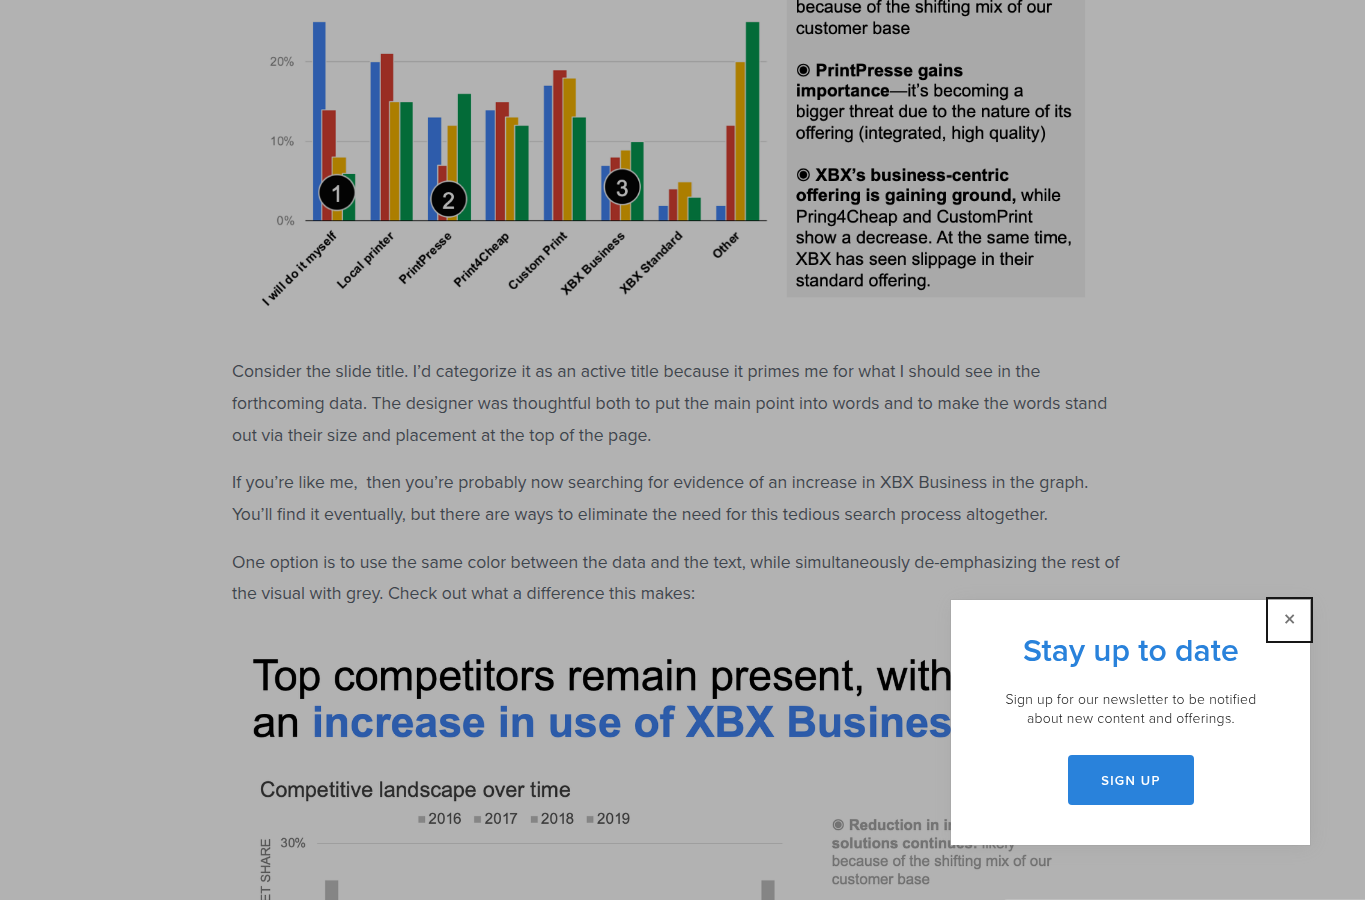
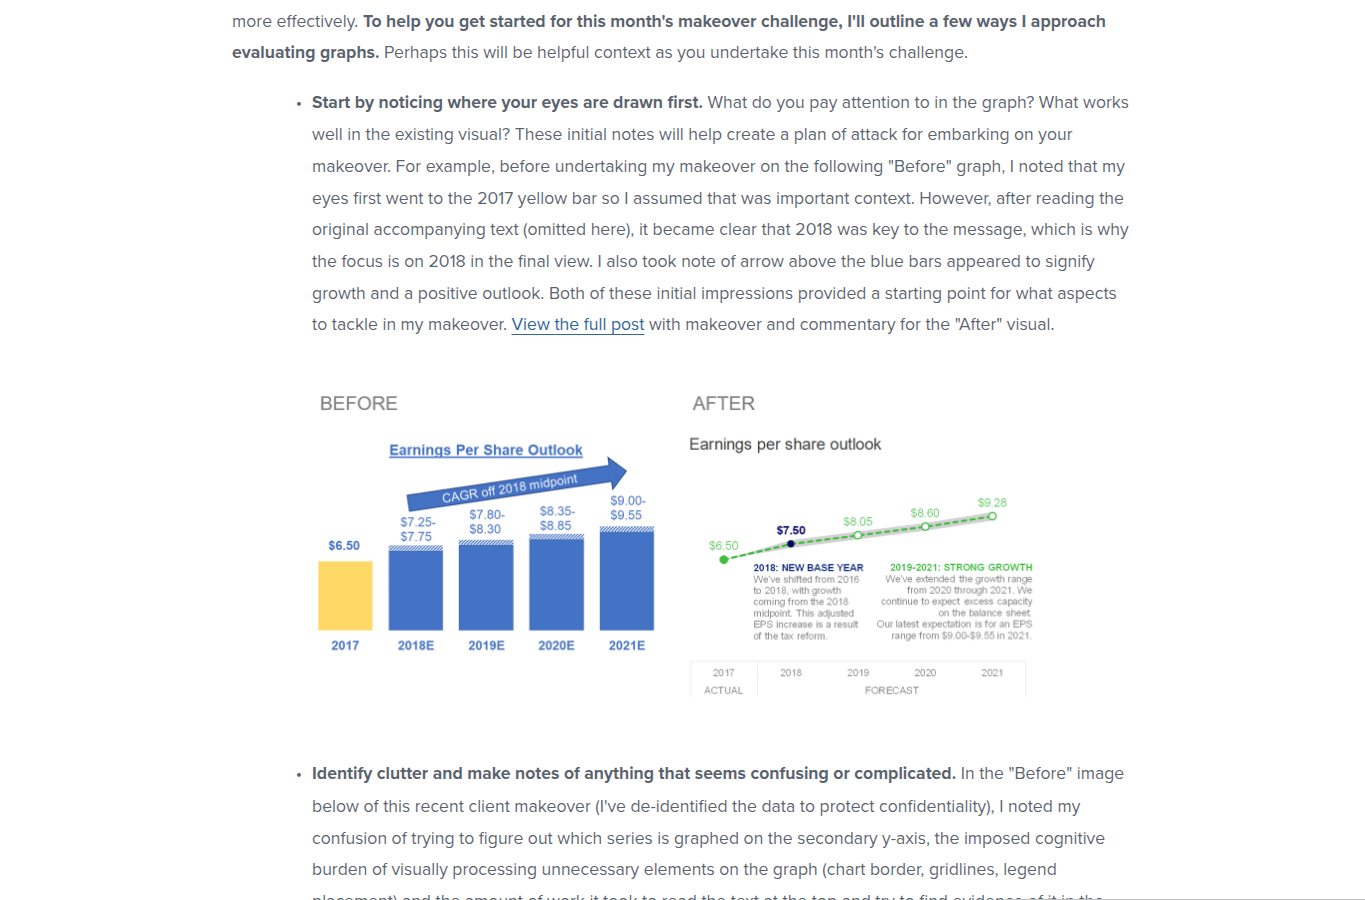
Story: a chart changes when it is designed for a reader's task, not the analyst's software output.
Open academyOpen quick brief: examples explained
FiveThirtyEight gun deaths
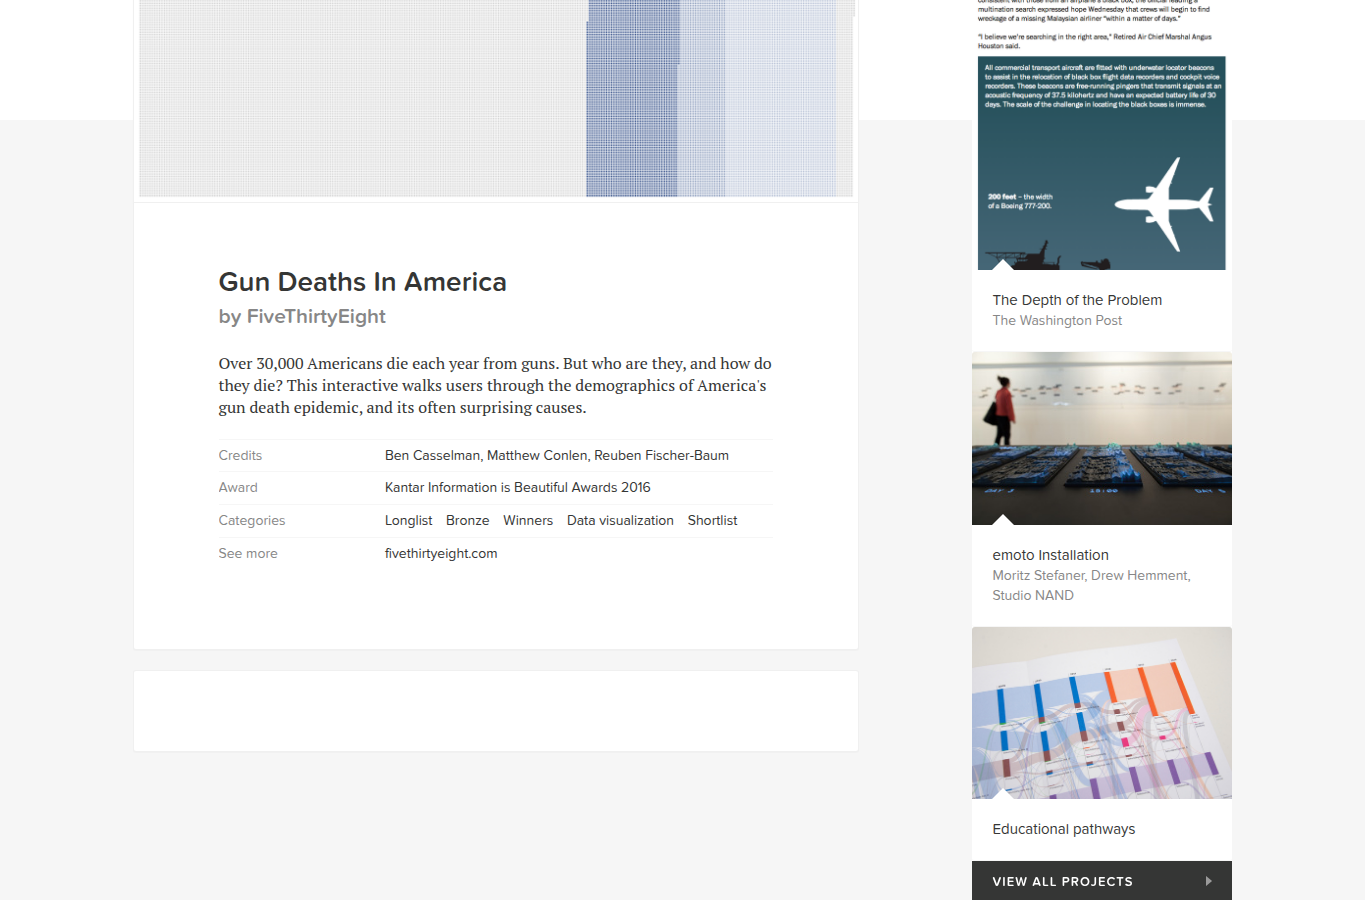
Data-only version: "33,000 people die from guns each year" plus a table by cause, age, and race. It is accurate, but it invites a generic response because the audience sees one large problem.
Story-led version: the project makes the audience ask which deaths they are trying to prevent. Suicide, homicide, domestic violence, children, older men, and mass shootings require different interventions, so the story uses segmentation to create decision-relevant groups.
OWID topic pages
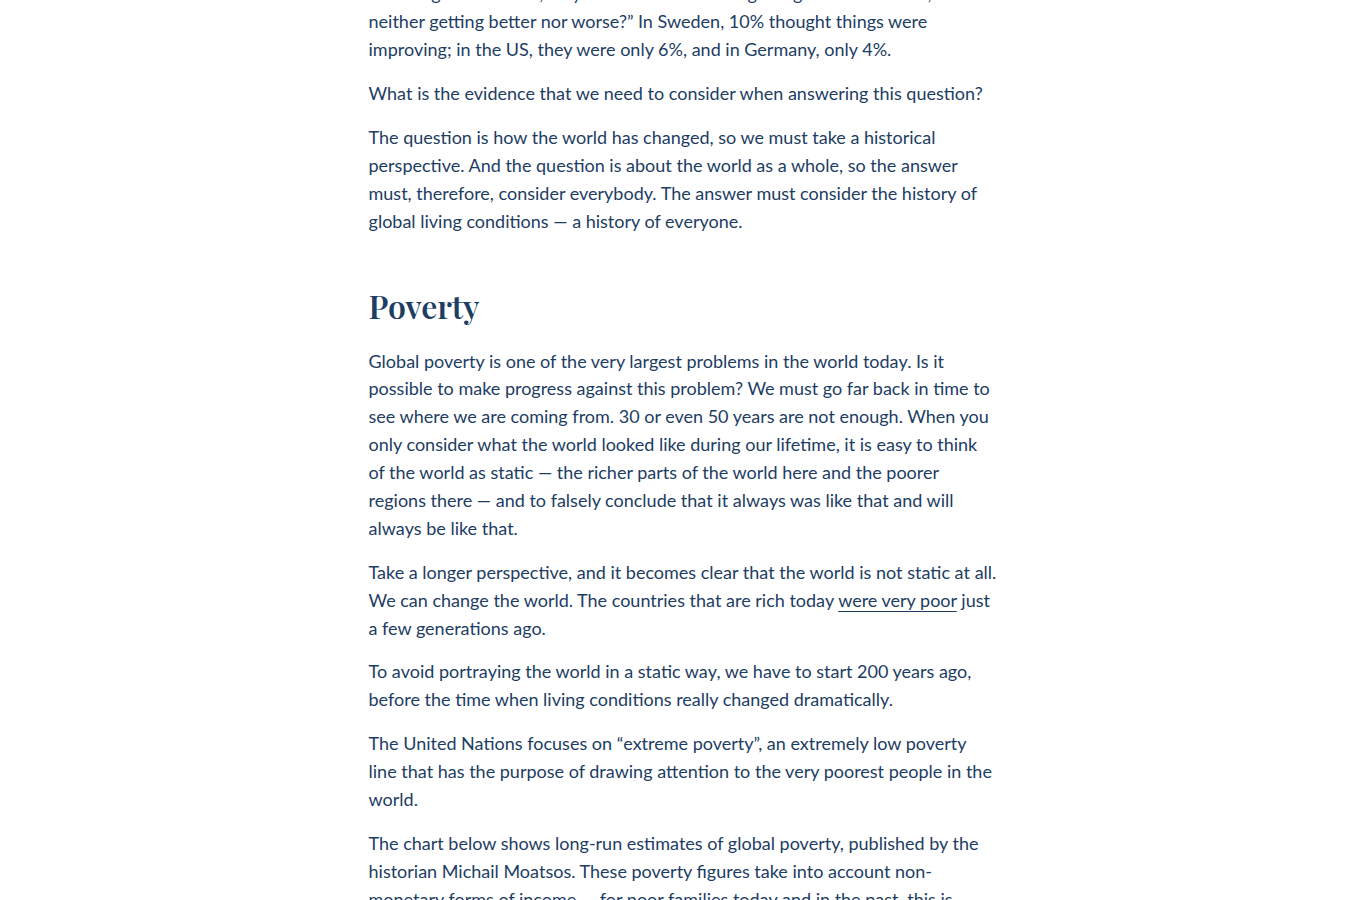
Data-only version: a searchable chart library of life expectancy, poverty, literacy, and mortality indicators. Useful for analysts, but not enough for a first-time reader.
Story-led version: OWID organizes the same evidence around public questions such as "are living conditions improving?" The page adds definitions, source notes, long-run context, and comparison so the audience can update a belief rather than merely inspect a chart.